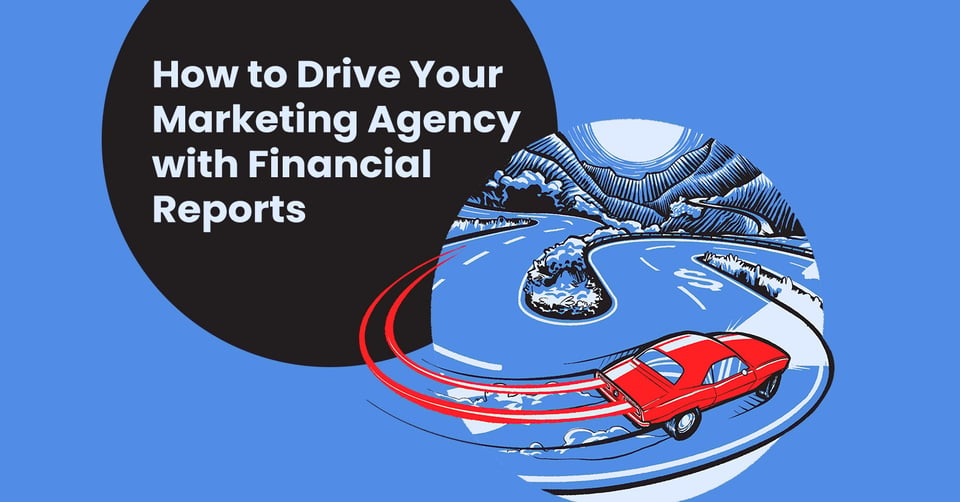
Imagine trying to drive a car while wearing blinders. Not only would you struggle to find your way, but you could also crash and damage others’ property as well.
If you’re operating a marketing agency without the right business intelligence, well, you’re doing something similar. Your partners, your employees, and your whole business is in jeopardy. Thankfully, a few simple financial business reports are all it takes to reorient you regularly.
That way, you’ll always know you’re on the road toward success.
The agency’s income statement reveals your trajectory
One of the most eye-opening business reports is the income statement. For a marketing agency, this can be like the visibility of a big, clear windshield and a good set of rear-view and side-view mirrors.
How? The income statement shows what money came in via sales (revenue) and how much money went out (expenses). Then, it uses those figures to display your profits (a positive difference between income and expenses) or losses (a negative). To visualize this, Harvard Business School (HBS) offers a sample income statement. 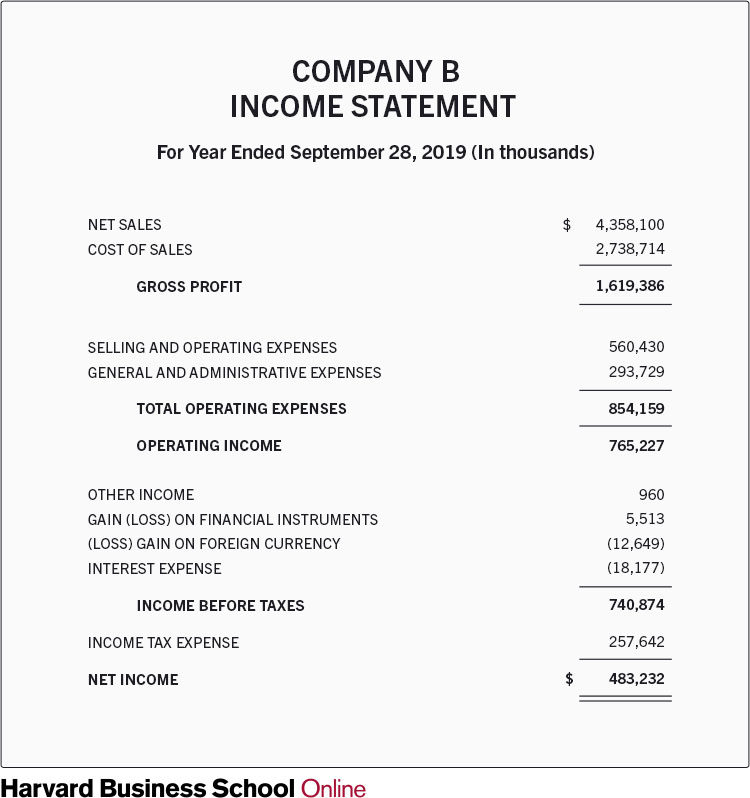
Source: HBS Online
This is among a few financial business reports that can be generated monthly or quarterly. The monthly and quarterly income statements inform yearly ones to show a bigger picture of where you’ve been financially—and where you’re headed.
“I focus on a few key financial reports to better understand how we have performed and how we will perform in the future,” says Patrick Carver. Carver is the CEO of Constellation Marketing, an agency dedicated to law firms. “The income statement has helped me know when I can afford to push our own marketing and drive new growth.”
Carver looks through the lens of his profits and losses displayed on his regular income business reports, just like a driver would a windshield. This clear picture shows you whether you’re moving forward or backward (net profit or loss).
It can also show leaders the immediate road ahead—not a full picture, though, not like a forecast—just the agency’s imminent trajectory. Likewise, just as a rear-view mirror shows you where you’ve been, you can decipher where you were recently and how you got to where you are now.
Based on what you see, you can decide to:
- • Accelerate. That is, spend more to grow faster. “With the help of those income statements, we found that our profit margin increased enough to grow our team,” recalls DifferentSEO agency founder Richard Garvey. “As a result, we started hiring more actively. It was a crucial decision that led to a significant expansion of the company.”
• Coast. Sometimes, you must cut costs to increase profits. This tactic allows your momentum to keep you moving as you gradually decelerate. However, momentum (without propulsion) peters out. Just be aware: As with any vehicle, coasting will result in an eventual full stop.
• Hard brake. Many agency owners look at the road ahead and see they’re headed for trouble. It’s part of being a business leader. A clear income statement can convince you to cut a program to prevent a crisis like burnout or collisions. Decisive hard brakes can also stop a negative trend if you see you’re headed in the wrong direction. For example, building a presence in an already-saturated market, chasing a trend that suddenly dissipates, or, like one business owner, tooling up to market a highly regulated product without learning the laws.
The agency’s statement of owner’s equity displays your ability to move
This report shows how much fuel you’ve put in your business’s tank. In business, fuel is money that you, the business owner, put (invest) into the business. Checking your equity statement—or fuel gauge—often ensures you only take money out of the business when your business has positive owner’s equity.
Specifically, these particular business reports show:
- • The business’s starting capital balance
- • Income and losses (just like on the income statement)
- • Owner’s inputs and draws
- • Ending capital balance for the period
The more an owner invests in the company, the more owner equity they have. For example, an “ending capital account” in one year could show $74,300 if:
- • $50,000 balance at the beginning of the year
- • plus $28,300 net income
- • no losses
- • plus $4,000 owner’s contributions throughout the year
- • minus $8,000 in withdrawals
As you can see, the statement of owner’s equity both gauges and explains your capital account balance.
Bench Accounting has published a helpful visual: 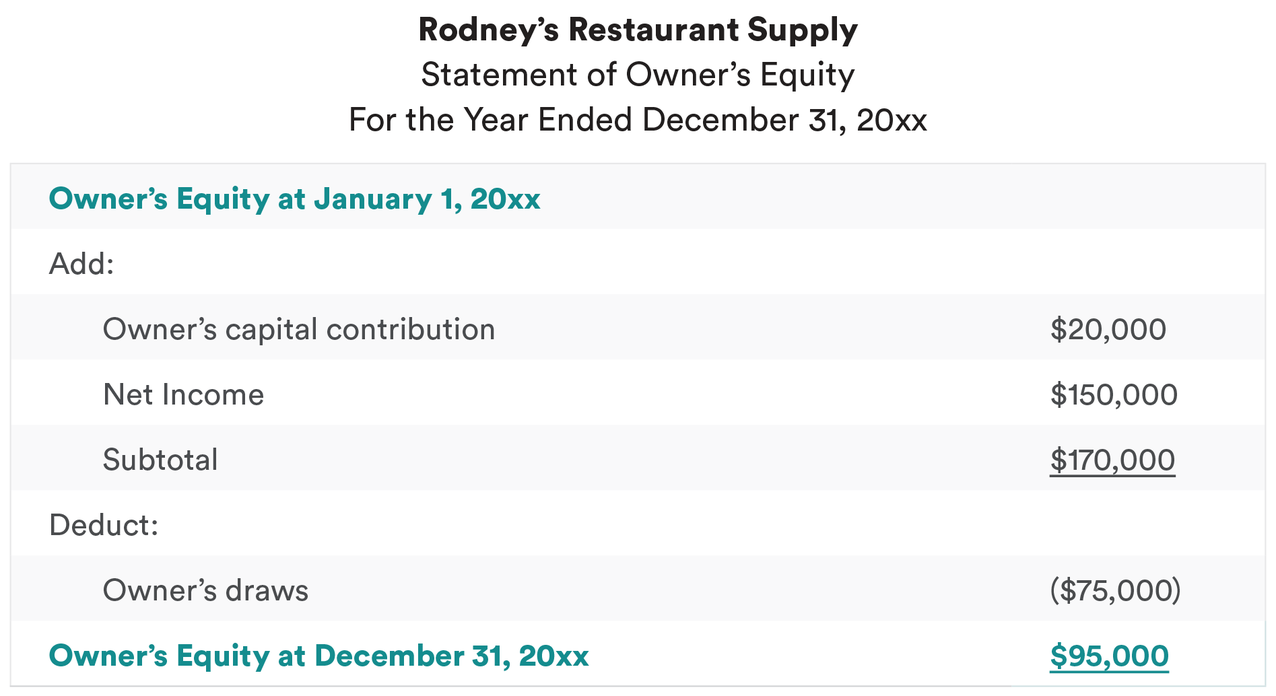 Source: Bench Accounting
Cash isn’t your business’s only fuel. Owners’ property, equipment, inventory, retained earnings, and more can be owner equity. Consider these extras like the vehicle’s tire air pressure, engine oil, and other fluids. They’re essential, but gas—the primary fuel—makes the thing go.
If a vehicle’s journey represents a business, then business owners must fuel up, also called “putting their own skin in the game.” But they must also add air to the tires and top off fluids, ensuring all aspects of the operation have the equipment and tools they need.
Of all the business reports an agency leader can read, the statement of owner’s equity is the best for this assessment.
The agency’s balance sheet maps out multiple perspectives
While it’s great to see through a big windshield, and while mirrors and a gas gauge can enlighten drivers, only a map can give you the perspective to help you get where you want to go. For marketing agencies, a balance sheet does exactly that—it’s a vivid map.
A balance sheet shows assets, liabilities, and shareholder equity. The higher your debt-to-asset liability, the more “leveraged” your business is. Once you see your position on the map, you can steer your business to both short- and long-term liquidity goals.
For example, for some drivers (marketing agency leaders), a long-term destination is to have a super healthy 2.0 current ratio. But to get there, the balance sheet can show the leader that the best route is to detour to focus on their quick ratio, which will support the goal (final destination) of that 2.0 current ratio.
Like a map, the balance sheet can be a fascinating, perspective-giving picture. Famous chartered accountant Mary Archer agrees: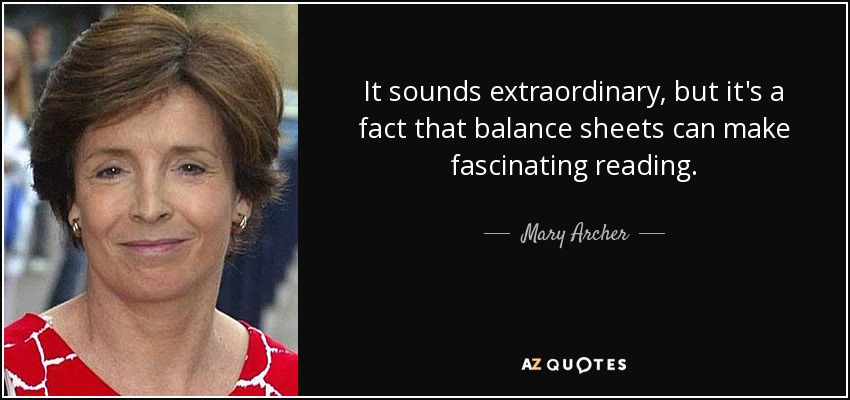 Source: The Wyoming Association of Municipalities via AZ Quotes
Like a map, the balance shows a static snapshot. It doesn’t show you the movement of the vehicle. Instead, it reveals where you are—in relation to where you’d like to be. Investopedia calls it exactly that: your cash position.
But beyond that snapshot, it also informs you what you need to get “where you want to go.” Financially, this would mean fulfilling debts and increasing your creditworthiness.
The agency statement of cash flows reflects cash transactions and their rhythms like a dashboard
In finance, we can compare a vehicle’s dashboard to a statement of cash flows for overall visibility.
This time, though, you’re not observing your trajectory, your potential detours, or your final destination. No, this visibility shows you how your vehicle—your operation—is performing. Specifically, it includes a reading on your engine’s RPMs (revolutions per minute). In finance, this is the timing of your money’s movements.
It reflects:
- • Cash from operating activities
- • Cash from investing activities
- • Cash from financing activities
HBS calls this report “one of the most critical financial documents that an organization prepares” because a business can be profitable and still fail without healthy cash flow.
“Last year, we realized that we need to change our payment cycles,” recalls Rahul Vij, CEO, WebSpero Solutions. Out of all his business reports, Vij says the cash flow statement illuminated this threat. “Although we were booking profits, we were struggling with the cash because of issues with payment cycles,” he recalls. “So we changed it and saw a positive impact on our cash flows almost immediately.”
Ironically, though, the opposite can also be true: Healthy cash flow can mask unprofitability. That’s why your dashboard—aka your cash flow statement—displays multiple gauges for visibility to see:
- • Cash negative or cash positive
- • The timing of cash’s movement
- • What cash flow activities to change to improve other activities’ performance
Business reports illuminate one more need
Together, reports like the above give you the visibility you need to make great choices. That said, they also reveal this: Every driver needs a navigator. Imagine driving with a colleague in the passenger’s seat—someone who has traveled this route and helped others get to the same destination a hundred times before. They’d be able to offer options as you’re approaching a certain junction or tell you what to do when an unexpected obstacle crosses your path.
Ignite Spot’s team of outsourced accountants do exactly that—they analyze your current financial position, check out the destination you’ve targeted, and then help you navigate toward it with ultimate visibility. How? Well, the most obvious way is that we generate these business reports for you as a “driven” business owner. So, remove your business blinders by calling Ignite Spot today. Your first 30-minute session is free, so why wait?




.png)


