
Your cash flow forecast is a foundational tool that allows you to look forward in your business instead of looking at the past. The first thing a client receives when starting CFO services at Ignite Spot is a cash flow statement. If you look at your cash flow forecast incorrectly, then you can make unwise business decisions. So it is equally important that you set up your cash flow with accurate data AND you know how to interpret it correctly.
This guide will teach you:
• The do’s and dont’s for creating a cash flow forecast
• The best practices and technology to make forecasting cash flow easier
What software should you use to create cash flow projections?

Director of CFO Services, Ryan Steck, recommends good old Excel. Why? The answer is flexibility. The data that you use to forecast cash flow can also answer important business questions like: When can I hire employees, When can I move into new verticals, and When can I work with investors and shareholders, all in the same file with different reports and ratio calculations. Excel’s customization allows you to scale your business without spending money on extra software or worrying about data integration between different programs.
“You can buy one software for cash flow, another for employee capacity, until you’re 30-softwares deep, or you can just use Excel.” Ryan Steck
Part 1 - Start with Your Actual Business Performance
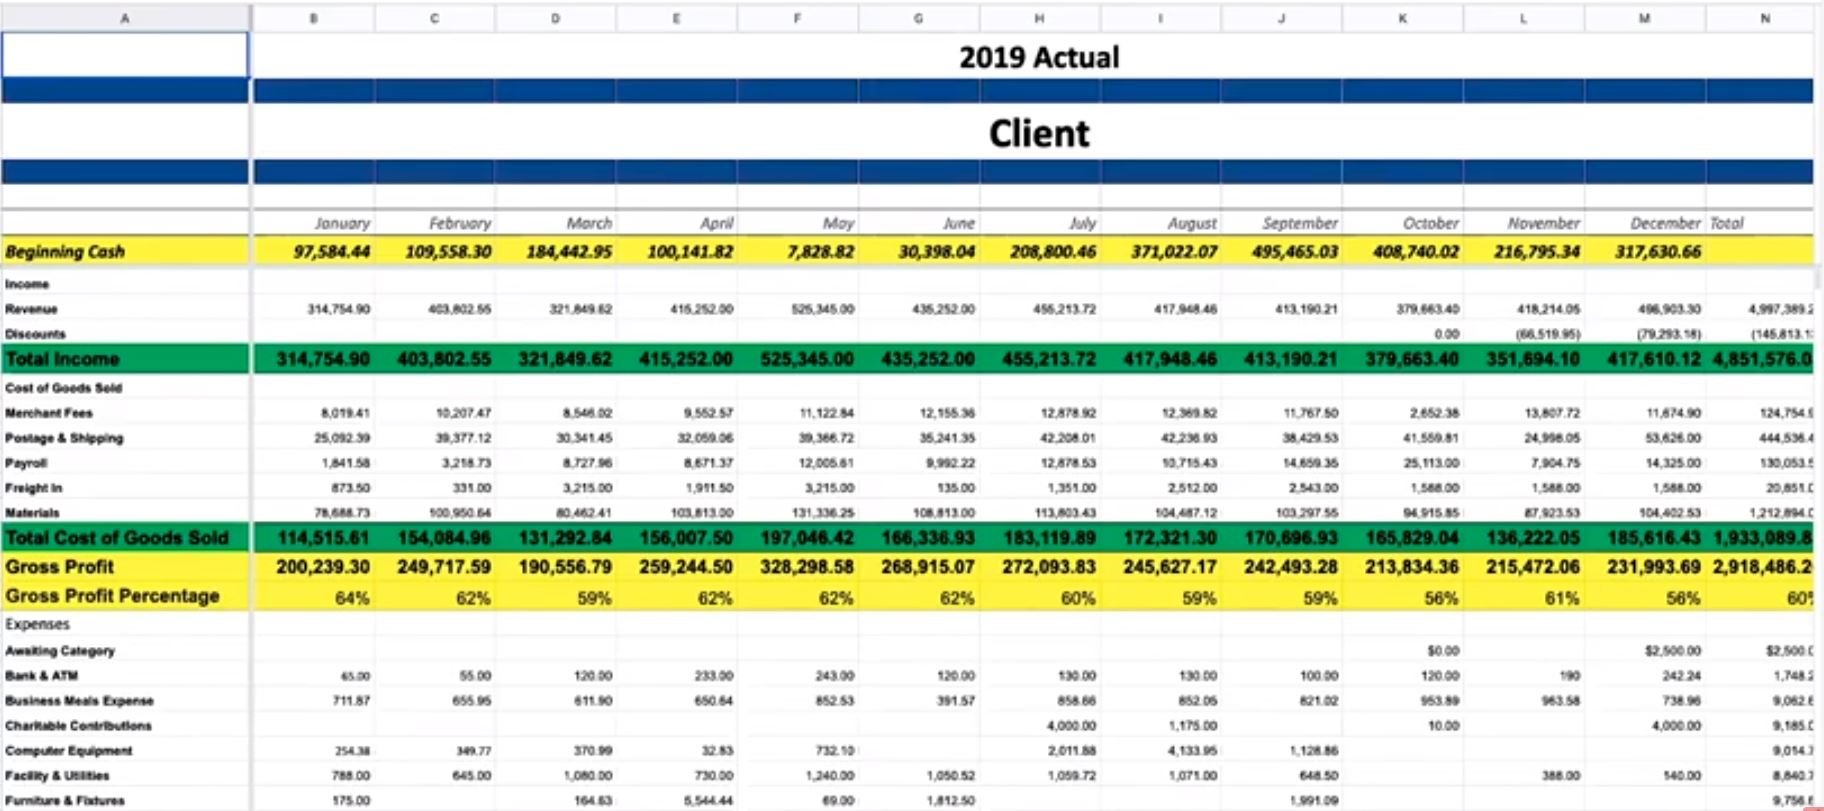
The first step to creating a cash flow projection is looking at your actual budget which reflects how your company has historically performed. As each month passes, enter the amount of revenue and costs you have over a 12-month period. This creates a schedule that shows you, from a cash flow standpoint, what your company is actually doing.
Get a Cash Flow Projection tailored for your business. Consult a CFO today.
Step 1 - Enter Beginning Cash
Start by entering the cash balance at the beginning of every month.

In the example above, $97,584 is the Ending Cash from December 2018. This number is from QuickBooks once the month has been reconciled. This is NOT the number from your bank account balance. If you start with your bank account balance, the forecast will be incorrect. That’s because it does not take into account the checks you’ve written that haven’t cleared yet, the checks you haven’t deposited yet, and other variables. Get this number from your bookkeeper by asking for the reconciled cash balance at the end of the month.
Step 2 - Enter Profit and Loss
After that, cut and paste the numbers from your Profit and Loss statements from the same periods(Jan, Feb, all the way to Dec) into the spreadsheet.
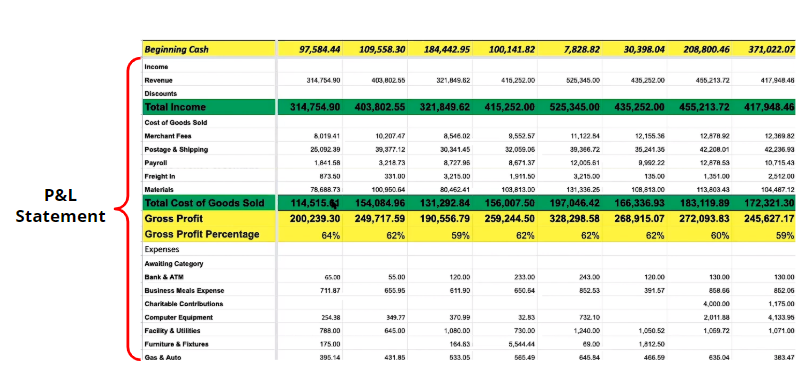
Include your revenue(total income) and costs(cost of goods sold). The total income is your gross revenue or everything you sold that month. The cost of goods sold(cogs) is the expenses that are directly related to what you sell. For example, if you manufacture ball caps, your cogs will be the cotton fabric you purchase to make hats, the plastic for snapback closures, and the labor for sewing machine operators. It does NOT include your costs for marketing, rent, or insurance. If you have a service-based industry, your billable employees who perform the service are part of your cogs. Whereas your staff and administrative employees’ salaries are not a part of cogs.
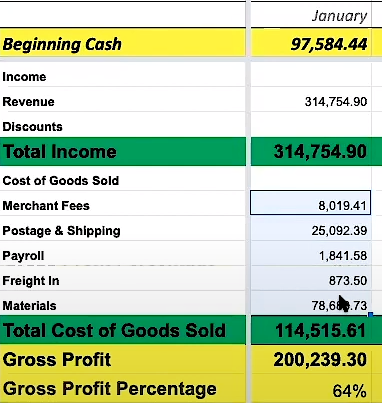
In the example below, the total cost of goods sold in Jan 2019 is $114, 516 including merchant fees, postage and shipping, payroll, freight, and materials.
Learn more about the cogs calculation.
Step 3 - Enter Gross Profit
“Gross profit is one of the most underutilized metric on a financial statement” - Ryan Steck, Director of CFO Services
The gross profit shows you how profitable your business would be if you had no costs to run your business or if operated from your basement. Steck explains that gross profit answers the question, “Can you be successful at your business doing what you do at the most streamlined level?”
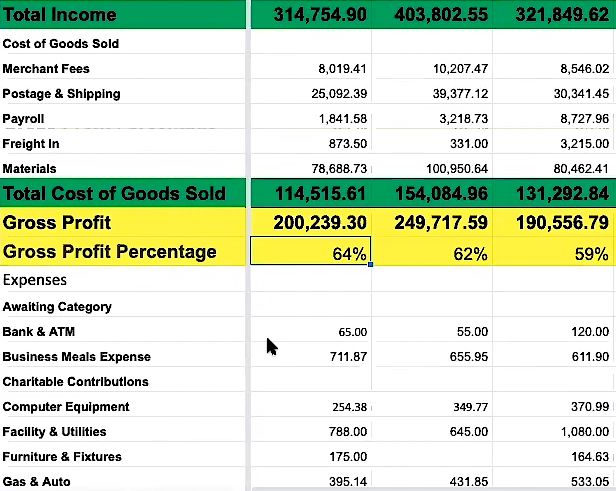
In the example above, the gross profit for January is $200,239.
Gross profit = Total Income - Total Cost of Goods Sold
Steck recommends showing your gross profit as a percentage to see how much out of every dollar made you can keep. To figure out your gross profit percentage, divide your gross profit($200,239) by your total sales($314,755). In January, $.64 of every dollar made can be applied to operating costs to keep the business running.
200,239 / 314,755 = .64
To determine if you have a healthy gross profit, the higher the percentage the more money you are making. If you have a high volume business that manufactures items that are cheaper to make and priced lower, you can operate with a lower gross profit if you sell a lot of items every month. Generally, having a gross margin of 50% or more is a good sign for your business. Steck notes that every industry is different.
Step 4 - Enter Total Expenses
The next step is entering all of your overhead costs or operating expenses. In the example below, the total expenses are $119,427 for January.
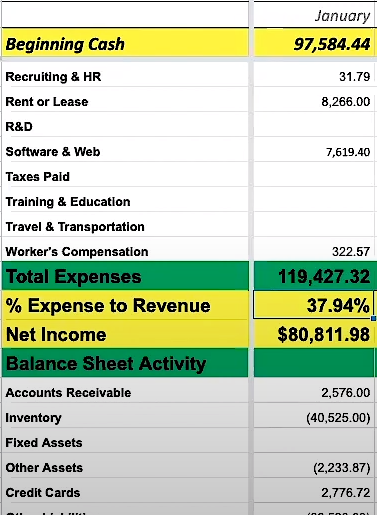
After totaling your expenses, you can calculate the Expense to Revenue to see how much of your income is used for your overhead costs. You can see from the example above that almost 38% of the money made in January was used to run the business. In other words, for every dollar generated you spend $.38 to keep the lights on.
119,427 / 314,755 = .379
Your advertising and marketing budget is included in your operating expenses. Marketing and advertising expenses are a growth component and should not be treated as a sunk cost.
Step 5 - Net Income
Your net income is NOT your net cash. To calculate net income, take the difference between your total expenses($119,427) and your gross profit($200,239). In the example above, the net income is $80,812 in January.
200,239 - 119,427 = 80,812
Figuring the net income is where most entrepreneurs go out of business. You cannot add your beginning cash and net income to calculate your ending cash. The movement of cash in and out of your business never stops and you have to account for that. Inventory, loans, and timing of AR/AP all impact how much cash you have available but do not factor in your expenses. Your net income is not a great indicator of what is happening to your cash that month. It shows you what you earned that month, but not your cash position.
Entrepreneurs love a clean P&L statement. You want to know what your bottom line is or the net income, but that’s only half of the story. If you feel like you're behind on your cash flow, it’s time to embrace your Balance Sheet.
“If you’re going to gauge the overall health of the company, it starts with the Balance Sheet.” -Ryan Steck
Step 6 - Enter Balance Sheet Activity
To figure your ending cash correctly, you have to understand how the Balance Sheet is affecting your cash that month. Here’s how:
Look at the balance at the end of the previous month. That’s Dec 31, 2018 in this example. Then look at the current month’s ending balance(Jan 2019) and find the difference between the 2 balances.
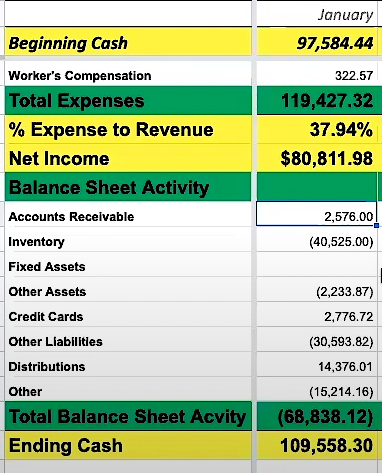
The Accounts Receivable line shows a positive increase in cash of $2,576 from December to January, meaning you collected more cash in January 2019.
Jan 31, 2019 Receivables - Dec 31, 2018 Receivables = 2,576
Make sure you are using the last day of the month’s balances to calculate the difference.
On the next line, Inventory is showing negative $40,525. That’s a significant amount of cash going out of the business.
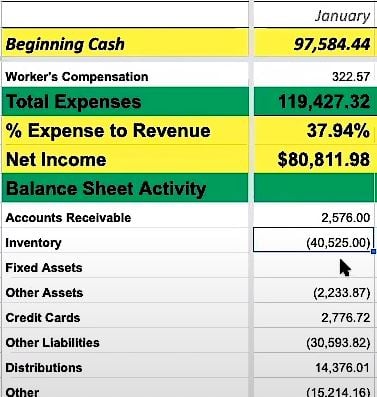
In this case, the negative number means you purchased a lot of new inventory that month.
When you purchase inventory, it goes on your Balance Sheet, not your cost of goods sold. You don’t expense inventory when you first purchase it, even though your cash goes down. The moment you sell the inventory is when it’s recognized as cogs and your income and cash go up. The reason why you don’t expense your inventory as soon as you buy it is to match the sale to the actual cost. It’s important to understand your profit per item sold.
Learn more about common inventory mistakes.
Any negative number(Inventory, Other Assets, Other Liabilities) is showing money going out. Any positive number(Accounts Receivable, Distributions) is showing cash going into your business.

At the end of the Balance Sheet Activity are Distributions. Distributions will show positive in the first month and negative in the rest of the months of the year. As business owners, you have the ability to pull money out or put money back into the company. That is what distributions track. This is not a wage or W-2 salary. Your withdrawals from the company are not an expense but do affect your cash flow forecast.
In the example above, the owner put $14k into the business and withdrew small amounts in the following months($557 in February, $270 in March, and so on). At the end of the year an amount of $13k was taken out in distributions as repayment or possibly a bonus.
Step 7 - Calculate the Ending Cash
After figuring your balance sheet activity, you can now calculate the ending cash. For January, the total balance sheet activity is a negative $68,828. This includes the difference in cash you received from December to January, the inventory you purchased, and the debt you paid down.
To calculate the ending cash add the beginning cash and the net income, then subtract the total balance sheet activity.
Ending Cash = Beginning Cash + Net Income - Total Balance Sheet Activity
The ending cash in January is $109,558.
97,588 + 80,811 - 68,838 = 109, 558
Step 8 - Enter Ending Cash as the Beginning Cash for the Next Month
Now that you have the ending cash for January, use this number as the beginning cash for February in the next column of your sheet. Continue with the same process of entering numbers from the P&L and Balance Sheet to calculate the ending and beginning cash for each month for the remainder of the year. Repeat the steps for a 12 month period to see the seasonality of the company. This will reveal the big picture of how your company performed that year.
Your actual budget is complete! You may be scratching your head and thinking, “How does this help me make projections for the future?” The first part was making the actual budget. The second part is where you make the projections for the next year based on your company’s performance last year with the schedule you just created.
Part 2 - Creating Projections

Copy the information from your Actual Budget and paste it into a new tab for your Projections.
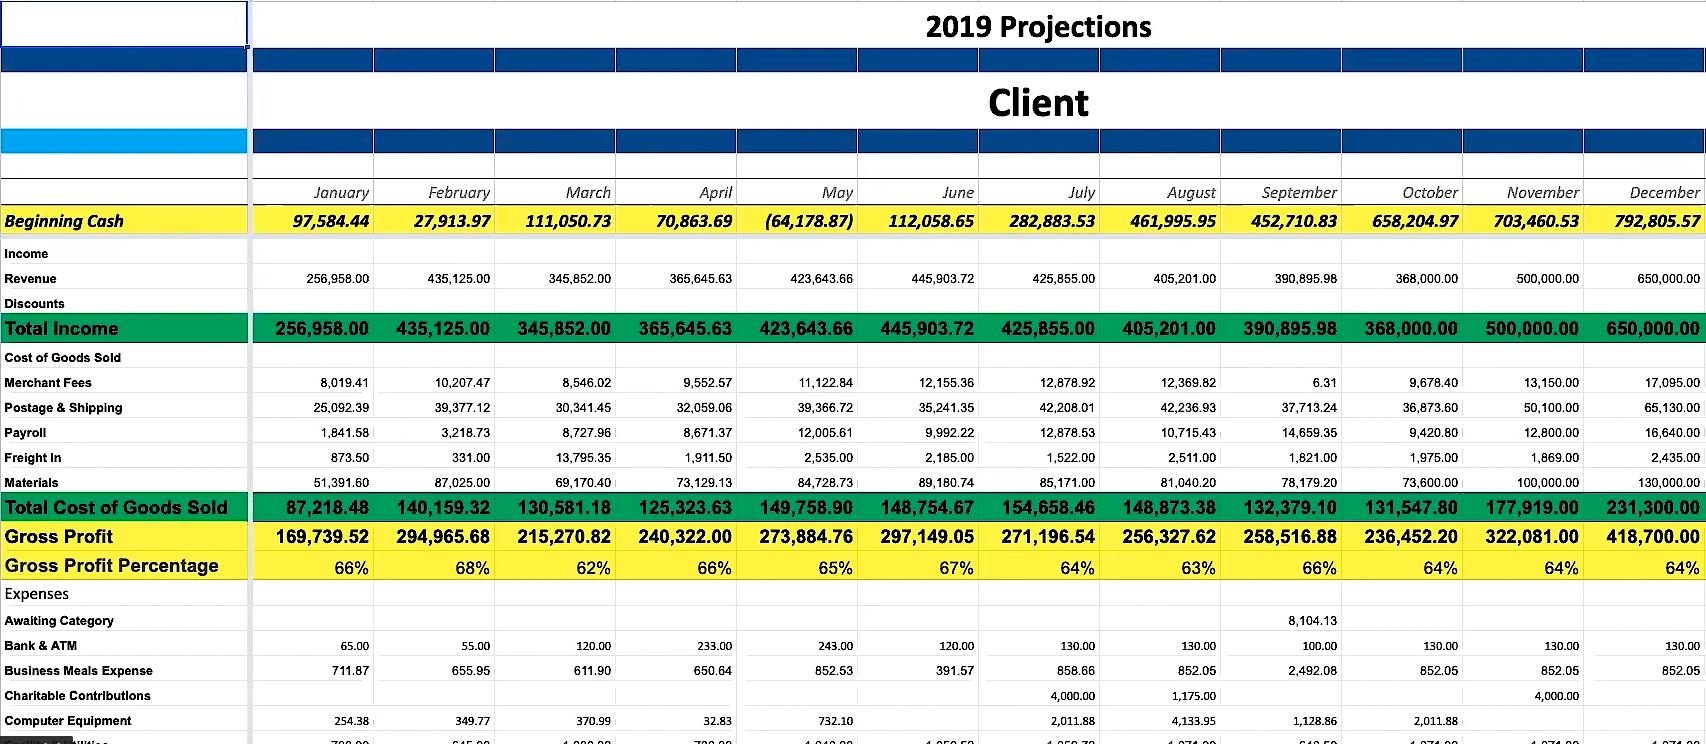
Delete the numbers from last year.
Enter the Ending Cash from December as the Beginning Cash for January.
Step 1 - Enter Revenue
Then you enter Revenue estimates for each month for the new year.
How do you know what to project for the new year?, you ask. “You start somewhere”, says Steck.

Predicting the revenue for the new year is the hardest part of doing cash flow projections. Here are a few ways to make an educated guess.
How to predict revenue for your business:
• Use last year’s numbers.
• Take last year’s revenue and predict a 10% growth rate. This can be done using Excel formulas from data in the Actual budget tab.
• Look at market trends and predict if your business will grow or contract.
• Or if you’ve been in business for several years, factor your growth year over year.
Newer businesses and startups should be more conservative in predicting growth. Eddy Hood, Ignite Spot CEO, warns to protect your business by not spending more cash because of inflated growth projections. For a more accurate projection, alway consider the numbers from the last 2-3 years, your market trends, your industry, and the seasonality of your business.
Once you decide on a growth rate for the next year, enter those numbers as the revenue goal for each month.

Step 2 - Enter COGS
Next enter the numbers from your previous P&L. When you enter the gross profit margin, you can predict more efficiencies in your business or a higher gross profit percentage. In the example below, the gross profit percentage increased from 64% on the actual to 66% on the projection.
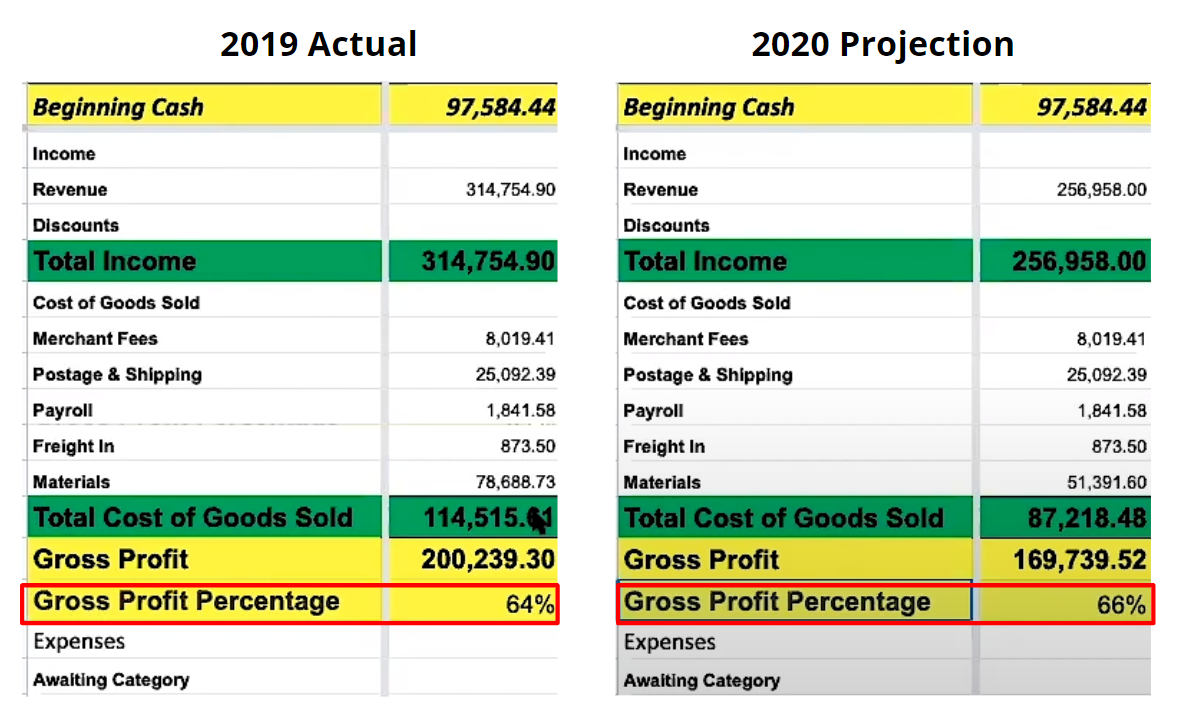
Your gross profit margin will not change dramatically unless you get new vendors, create new processes, or become better at managing costs for your business.
Step 3 - Enter Overhead
Now that you have the projections for the income and cost of goods sold, next enter your overhead. Overhead usually will not change very much from year to year with the exception of advertising and marketing efforts. Don’t spend your time penny-pinching your overhead costs.
Instead of stressing about the budget of expenses like your phone bill, always spend more time making your cogs more efficient before your overhead.
“Savings from your cost of goods sold grow with your increased revenue.” Ryan Steck
When entering your total expenses, take extra time on the Marketing & Advertising and the Salary and Wages sections.
Step 4 - Enter Balance Sheet Activity
Enter these numbers by reviewing your loans, credit card debt, and how many owner draws you will take throughout the year. You can also plan how much inventory you will purchase throughout the year and when it will sell depending on the seasonality of your business.
Step 5 - Compare Your Beginning and Ending Cash
After you have your projections for revenue, income, expenses, and balance sheet activity, you can now see how your cash will grow or contract over the next year. In the example, the Beginning Cash in January is $97,584. This number was based on actual data from previous business activities. By December the Ending Cash is $757,879. That’s a great year of growth assuming you hit all of your goals.

Before you celebrate predicting a profitable new year, review your Ending Cash for each month. By looking at your monthly projections you can see which months you’ll need additional capital to run your business. For example, April is showing a negative Ending Cash of $64,178.
Part 3 - Create a Summary Dashboard

In another tab, track key metrics to compare what you projected that month to what actually happened.
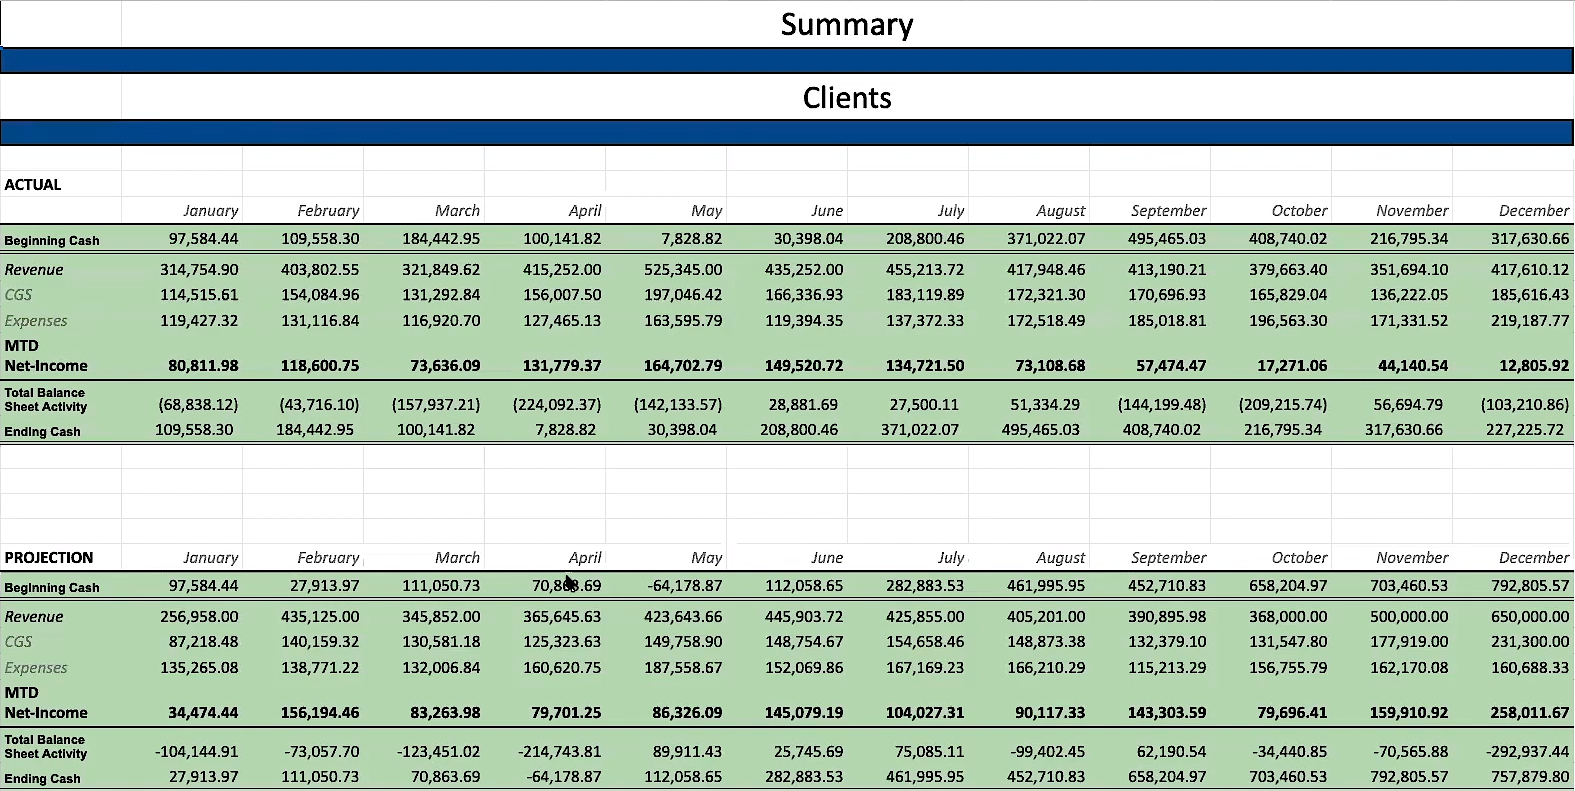
Step 1 - Track Key Metrics
Here are the metrics you want to review:
• Cash
• Revenue
• Cogs
• Operating expenses
• Income
• How the balance sheet affected your cash
• Ending Cash

Step 2 - Compare Projections Vs Actuals
Next, create a table that shows the difference between your projection and the actual performance to see the accuracy of your projections. Months where the revenue is positive, such as January, show you made more money than projected. However, in February, the revenue projection fell short -$31,322. Having a record of your actuals to projections helps you see what months you predicted more revenue and assess why you fell short of your goals. You’ll be able to refine your projections over time, giving you a more realistic forecast for your cash flow.
Steck notes that some business owners like to compare actuals and projection in columns next to each other, but he prefers to see the difference in a separate table. Having a separate dashboard allows you to easily see where your projections are significantly different from your company’s actual performance. If your projections are very wrong, then you want to adjust them to match closer to reality. The dashboard spotlights errors in your predictions to investigate, such as spikes in your cost of goods sold or drops in your projected revenue.
Update your actual numbers every month to compare it to your year’s projections. Congratulations! You’re on your way to more accurately forecasting cash for the future.
If you feel like you’re running your company in the dark, then our profit coaches can shine a light on your cash flow. Schedule a FREE 30-min CFO session to start building cash reserves to grow your business today!


.jpg?width=960&length=960&name=IS_Biller%20Genie_SM%20(1).jpg)



.png)


