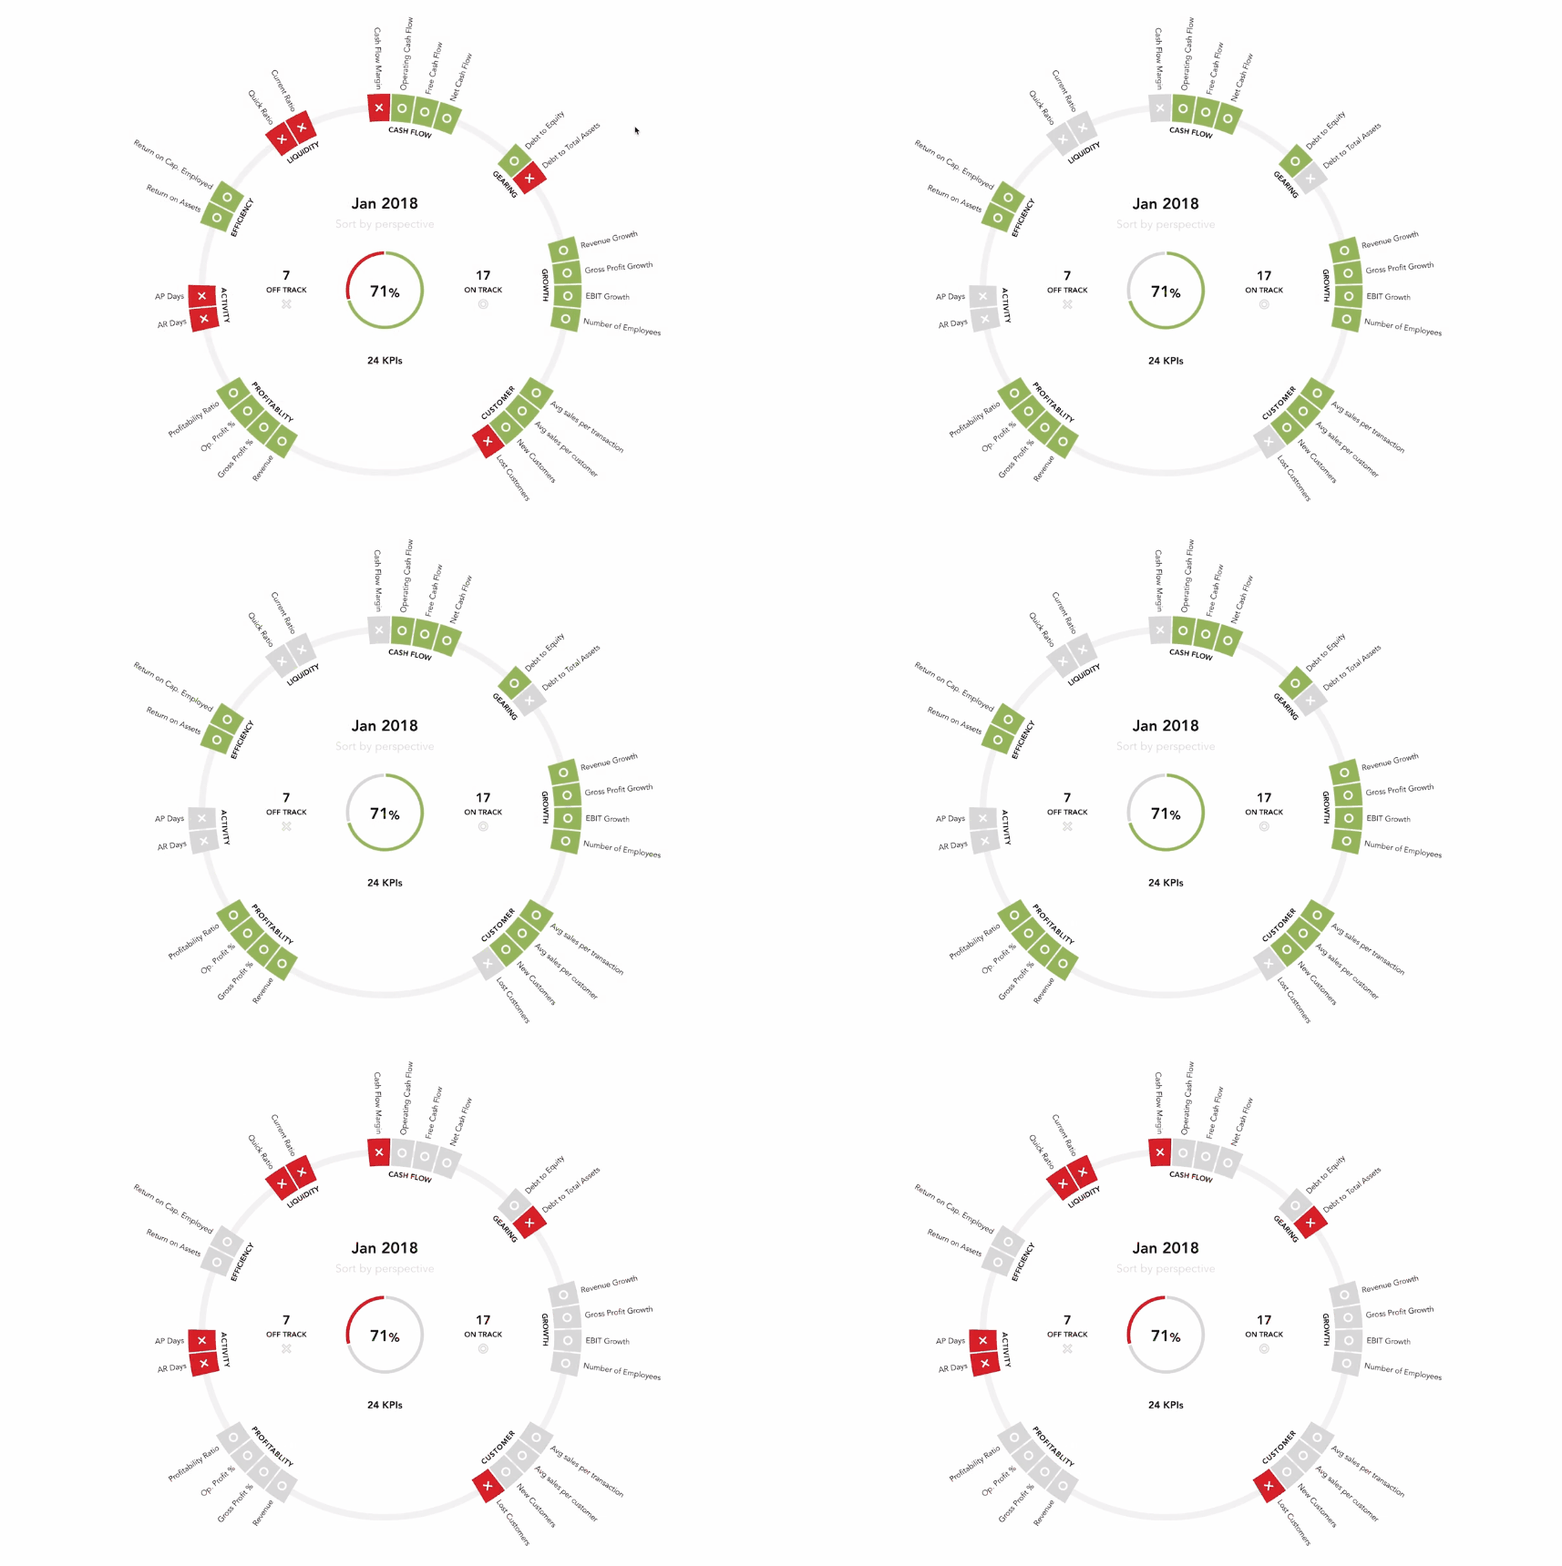
It’s tempting to track the dozens of accounting ratios available to measure your business’s performance. Your dashboard needs will also vary based on your business model and industry. Eddy Hood, Ignite Spot CEO, recommends picking 3-5 metrics to avoid getting lost in the numbers.
“The more you track, the less you can affect. If you track 18 ratios in your business, then it’s hard to create objectives to improve those ratios. If you focus on 3-5 ratios that are the most important to your business, then you can see progress toward your goals.”
Watch the How to Read Financial Statements webinar for a more detailed overview of financial KPIs.
What’s the Difference between Dashboards and Reports in Excel?
Dashboards are visual snapshots of your company’s performance or ratios. They help you make quick, strategic decisions. Reports, such as your Profit and Loss Statement(P&L) and Balance Sheet, show a breakdown of your numbers including your revenues, costs, and expenses during a specific period of time. Excel allows you to create customizable dashboards that pull data from your financial reports.
Watch the How to Analyze Your Business Using Excel webinar to learn more.
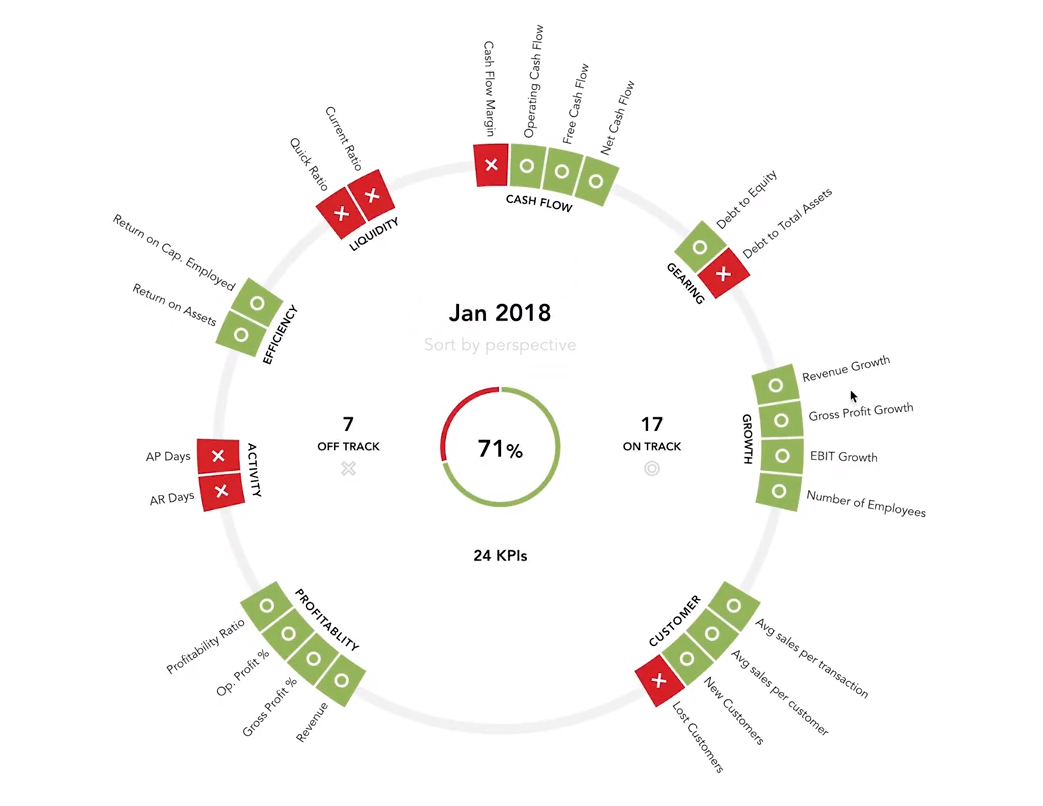
Track KPIs and Metrics. Fathomhq.com
How to Create an Excel Dashboard?
Before creating your dashboard, you should decide what KPI you want to illustrate and how often you need the data to be updated. The next step is getting the data into Excel. This process is easier if you already have the information in Excel or use QuickBooks Online, which connects to financial analysis tools like Fathom. Ignite Spot creates customized dashboards for your business using Fathom as a part of your monthly financial package.
5 Key Metrics To Track for Your Business
1. Gross Margin (Gross Profit to Total Income)
If you want to know how profitable your business is, then refer to your gross margin ratio. Eddie explains why gross margin is critical to your business:
“This margin is huge. It tells you the effectiveness of your business’s ability to make money.”
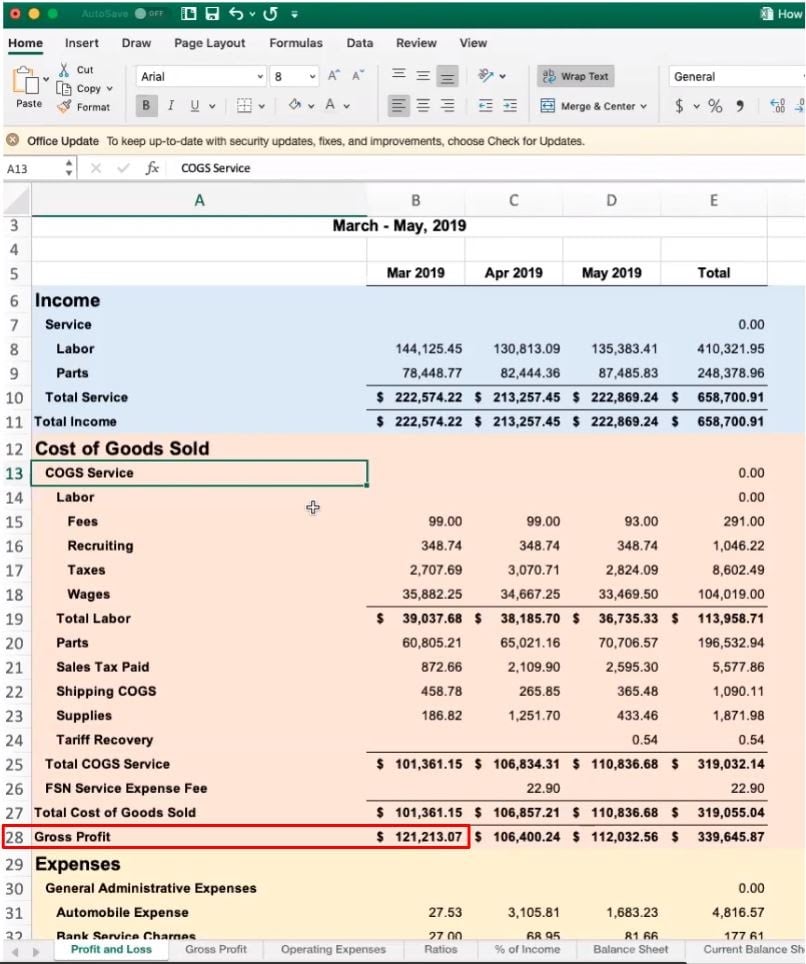
The gross margin ratio compares your gross profit to your total income. Gross profit is listed as a line item halfway down on your P&L, under the cost of goods sold(COGS). To calculate your gross margin, divide your gross profit by your total monthly sales for a percentage.
Gross Income - COGS = Gross Profit
Having a percentage helps you to accurately compare your company’s performance from month to month. Gross profit shows you how much money is leftover from your sales after COGS or costs incurred from offering your service. Knowing your gross margin can help you determine your break-even point and create savings goals for your expenses.
Director of CFO Services, Ryan Steck explains why you should keep gross margin as a running total.
“This ratio changes every month. Unless you have a business that has the same costs or you have refined your processes and know your exact manhours, material costs, or the type of waste your business has, the gross profit tends to fluctuate.”
The higher your gross profit ratio is, the healthier your company is. That’s because you’ll have more money from sales to allocate to your personal wealth, operating expenses, and debt sitting on your balance sheet that’s eating your cash. While looking at your gross profit ratio, think about the percentage as the number of cents you keep to pay for your business for every dollar you earn. Eddy explains:
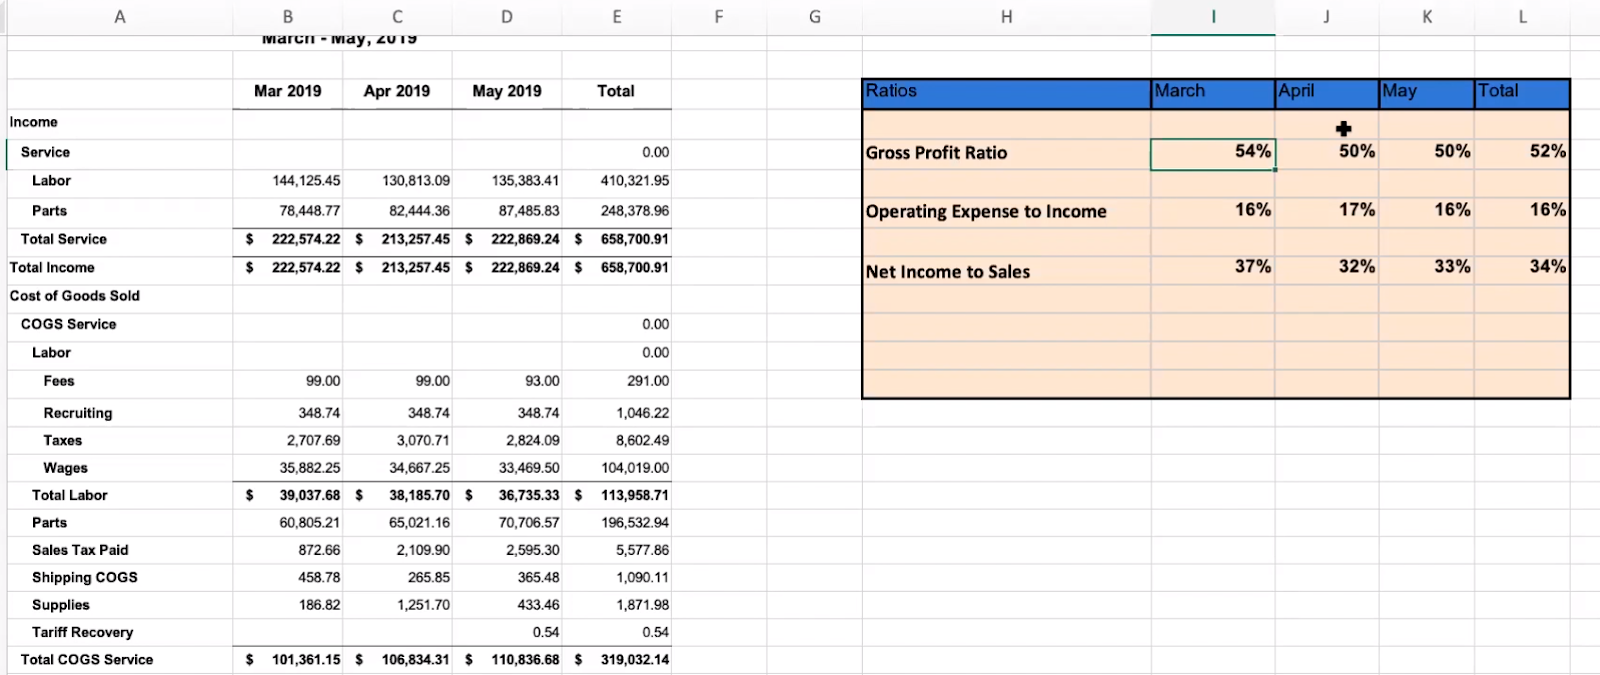
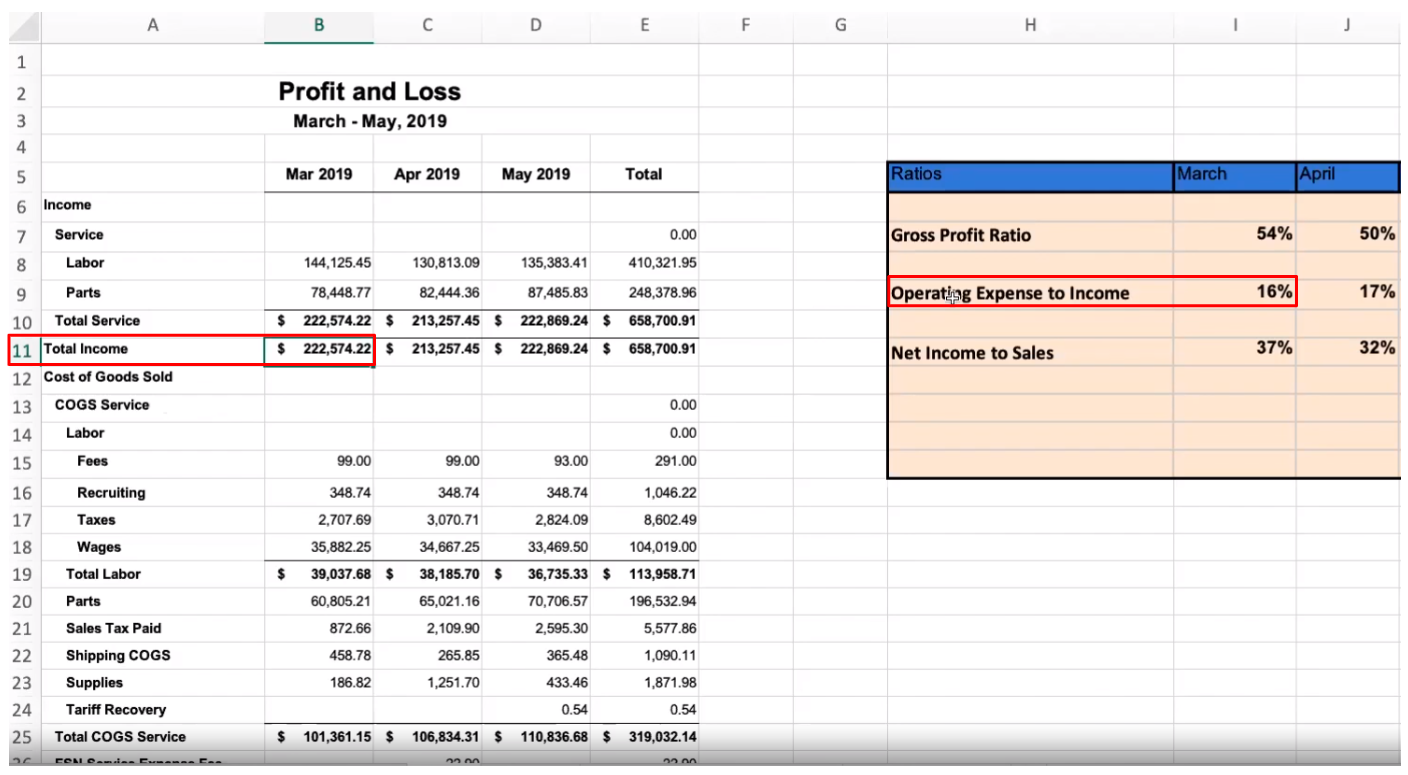
“For example, if you have a 54% gross profit ratio, then, for every dollar you earn in sales, you keep $.54 to pay for your business including rent, insurance, and wages.”
Learn more about how to increase your gross margin here.
2. Net Margin (Net Income to Sales)
The net margin shows your earnings left after expenses are deducted from revenues. To find your net margin, take your total bottom line on your P&L(net income), and divide it by your total sales. In the example below, the net margin is 37%($83,424.75 / $222,574.22).
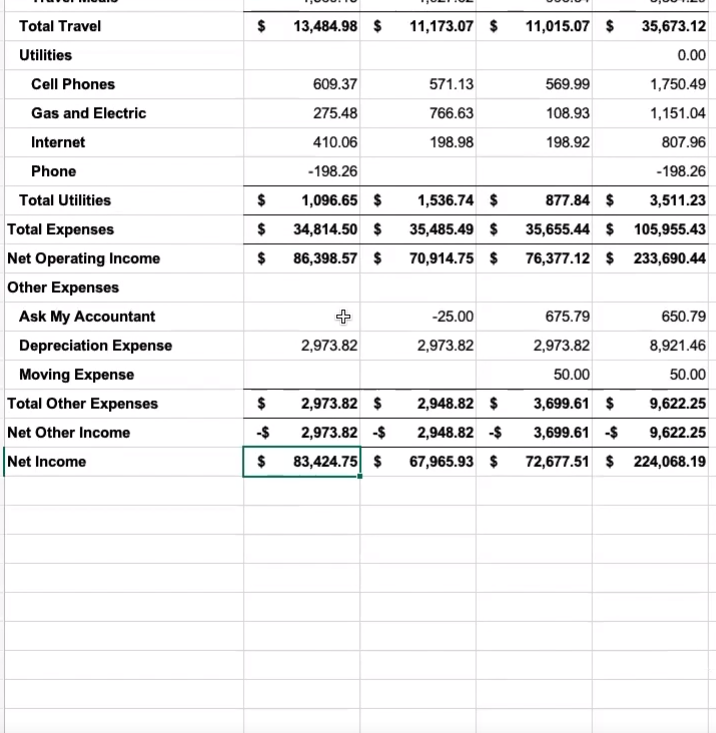
The net margin ratio(37%) is smaller than the gross margin(54%), because it includes selling and administrative costs or fixed expenses. Unlike the gross margin, the net margin includes the effect of income taxes. A decrease in either your gross margin or net margin should both be monitored carefully.
Eddy says, “Brand new companies that aren’t making any sales, but are spending money like crazy can have a negative net income to sales percentage.” Steck has a general rule for your net income ratio:
“When this number is less than 10%, I get concerned about your company.”
Steck states that all entrepreneurs should be able to keep at least 10% or your hard-earned sales. “If you have a million dollar-company and only get to keep $100K, would you feel good about it?” Steck asks.
3. Operating Margin (Operating Expense to Income)
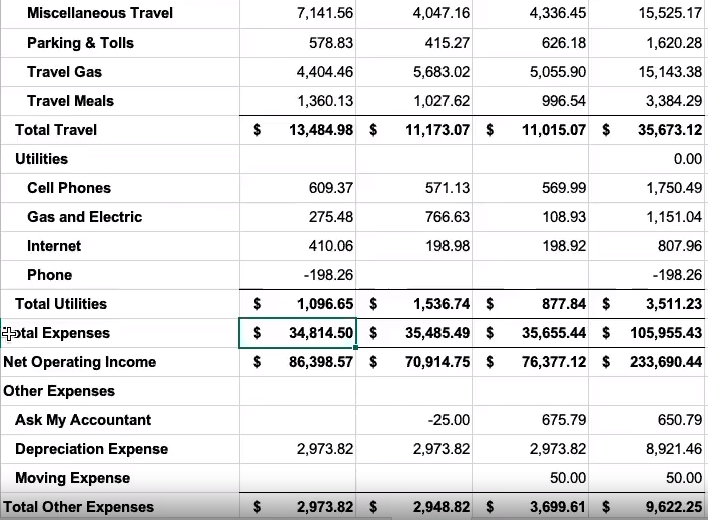
The operating margin is your total expenses for a month divided by your total income on your P&L. Steck explains, “This ratio shows you the costs to keep your business going, not to make what you make.” In the example above, the total expenses for March is $34,814.50 divided by the total income of $222,574.22 for an operating margin of 16%. That means 16% of your gross revenue or sales goes toward running your business, not your product or service offering.
Unlike your gross margin, you want to keep your operating expenses to income ratio as low as possible. Steck advises, “You can’t know the direct benefit of having more operating expenses.”
4. Current Ratio (Current Assets to Current Liabilities)
The current ratio measures your company’s liquidity or ability to cover your bills over the next 12 months. On your balance sheet, it compares your total current assets to your current liabilities. Check out a free current ratio calculator from CFI.
Current Ratio = Current Assets / Current Liabilities
Stakeholders such as investors, creditors, and suppliers look at your current ratio to determine if you can use your current assets to settle your debt and payables. What's considered to be a good ratio depends on your industry, but generally, a ratio of more than 1 suggests a healthy company. However, a ratio that is very large could mean you have an excess of cash that you could use to invest in the growth of your business.
5. EBITDA Margin
EBITDA margin shows you how much in earnings your company is generating before interest, taxes, depreciation, and amortization, as a percentage of revenue. Calculate your EBITDA using your income statement by taking sales revenue and deducting operating expenses including the cost of goods sold and administrative expenses, but not including depreciation and amortization.
EBITDA = Operating Income (EBIT) + Depreciation + Amoritization
EBITDA Margin = EBITDA / Revenue
Your EBITDA margin can determine your company valuation and gives investors a sense of how much is generated for every $1 of revenue earned. A higher EBITDA margin means your company has a smaller amount of operating costs compared to your total revenue, making your business more profitable.
Tracking trends in your ratios and taking intentional action to improve metrics over time makes all the difference to your business. While 1-page graphics provide a quick check of your company’s health, it helps to have a financial advisor to interpret the data and guide you in making better decisions for the future. The skill of creating projections is outside the scope of an accountant, who reviews your company's historical data, compared to a CFO, who shows you opportunities to build a cash reserve and increase your margins for the future.
Schedule a free 30-min CFO session now to get expert advice on how to improve your business’s profitability and performance.


.png)


